Microsoft Power BI is a business intelligence platform that helps organizations visualize and analyze data. It provides a suite of interactive data visualization and business intelligence tools that enable users to create, publish, and share data insights in a user-friendly environment. Power BI allows organizations to turn data into actionable insights, making it an essential tool for decision-makers who want to gain a competitive edge.

The fundamentals of Microsoft Power BI include the following:
Data Connections: Power BI allows you to connect to a wide variety of data sources, including Excel spreadsheets, on-premises SQL Server databases, cloud-based data sources like Azure SQL Database, and many more. Power BI provides a simple and intuitive interface for connecting to your data and defining the relationships between your data sources.
Data Transformation: After connecting to your data, Power BI provides a powerful data transformation engine that enables you to manipulate and clean your data, so it’s ready for analysis. You can use Power BI’s data transformation tools to create calculated columns, perform transformations such as pivoting and unpivoting data, and apply filters to your data.
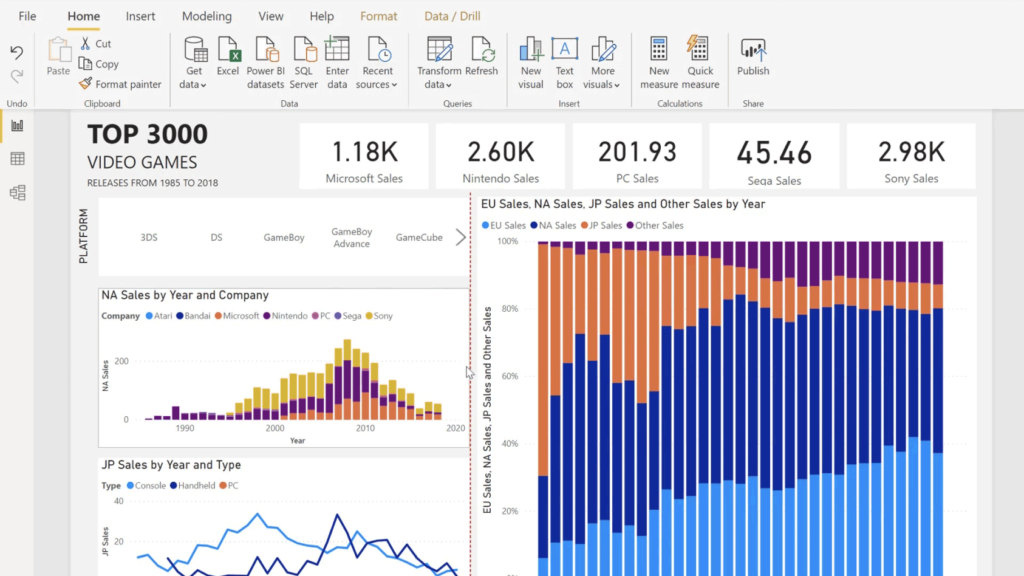
Data Visualization: Power BI provides a rich set of data visualization options, including charts, tables, and maps. You can create interactive visualizations that help you explore and analyze your data, and you can customize these visualizations to suit your needs. Power BI also provides a library of pre-built visuals that you can use as a starting point for your data visualizations.
Dashboards and Reports: Power BI allows you to create interactive dashboards and reports that provide a visual representation of your data. You can use Power BI to create and publish interactive dashboards that provide an at-a-glance view of your data, and you can share these dashboards with others. Power BI also provides a report authoring tool that enables you to create detailed reports that provide deep insights into your data.
How to use Power BI:
Connecting Data Sources: The first step to using Power BI is connecting data sources. Power BI supports a wide range of data sources, including Excel workbooks, cloud-based data sources like Azure SQL Database, and on-premise data sources like SQL Server.
Creating Dashboards and Reports: Once you have connected your data sources, you can start creating dashboards and reports. Power BI provides a range of visualization options, including bar charts, pie charts, line charts, and more. You can easily create interactive dashboards by dragging and dropping data elements and applying filters.
Sharing and Collaborating: Power BI allows you to share your dashboards and reports with others in your organization. You can share with specific users or publish your reports to the web for wider access. Collaboration is also possible with Power BI as you can work on reports and dashboards with others in real-time.

Advantages of using Power BI in the IT Industry:
Improved Business Intelligence: Power BI provides a rich set of business intelligence tools that enable organizations to gain a deeper understanding of their data. With Power BI, organizations can turn data into actionable insights that help them make informed decisions and gain a competitive edge.
Easy to Use: Power BI is designed to be user-friendly and accessible for people with different skill levels. With a drag-and-drop interface and pre-built templates, it is easy to create stunning data visualizations and reports in just a few clicks.
Simplified Data Integration: Power BI provides a simple and intuitive interface for connecting to and integrating your data from a variety of sources. Power BI makes it easy to bring your data together in one place, so you can gain a complete view of your data.
Improved Collaboration and Sharing: Power BI provides a collaboration and sharing platform that enables organizations to share their data insights with others. With Power BI, you can share your reports and dashboards with others in your organization, and you can control the level of access that others have to your data.
Real-Time Data Insights: Power BI provides real-time data insights, allowing organizations to quickly respond to changes in their data. This helps organizations to make informed decisions quickly and efficiently.
Wide Range of Data Sources: Power BI supports a wide range of data sources, including cloud-based data sources and on-premise data sources, making it possible to integrate data from multiple sources into a single dashboard.
Improved Data Visualization: Power BI provides a range of visualization options, allowing organizations to present data in a visually appealing and informative way. This helps organizations to make data-driven decisions and to communicate information effectively to stakeholders.
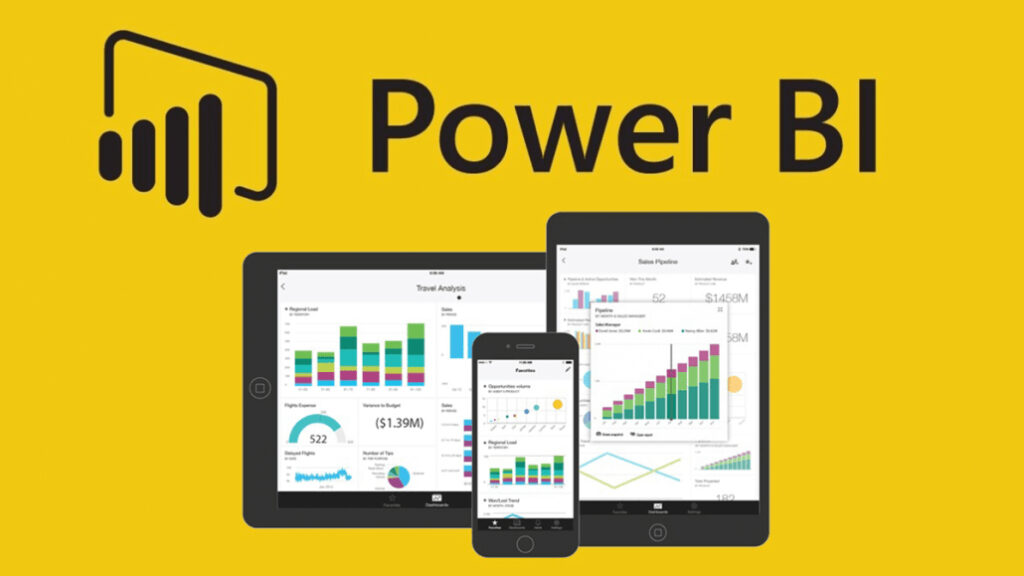
Mobile Access: Power BI provides mobile access, allowing users to access their dashboards and reports on the go. This helps organizations to stay connected and make informed decisions even when they are out of the office.
Scalability: Power BI is a scalable solution, making it suitable for organizations of all sizes. Whether you are a small business or a large corporation, Power BI provides a solution that is scalable and flexible to meet your needs.
In conclusion, Microsoft Power BI is a powerful business intelligence platform that provides organizations with a suite of interactive data visualization and business intelligence tools. Power BI enables organizations to turn data into actionable insights, making it an essential tool for decision-makers who want to gain a competitive edge.
