
There is a ridiculous amount of data to be analyzed. To properly evaluate and validate multiple hypotheses, many queries must be posed, dissimilar data must be correlated, and informative representations of simulated processes and actual phenomena must be created. Before the data can finally be viewed and analyzed, the scientists need to choose data sets and construct sophisticated dataflows that apply a series of operations to the data to generate relevant visual representations. Unfortunately, today’s procedure includes several error-prone and time-consuming activities. Data is an asset in today’s modern economy, an economic component of production in digital goods and services. This new function for data has consequences for both competitive strategy and computing’s future. For any organization, irrespective of size or type, provided data’s important and mission-critical function, effective management techniques, and a solid management system are required. A data management platform is the underlying technology for gathering and analyzing massive amounts of data throughout an organization. Software solutions tools created by the database provider or third-party suppliers. These data management tools assist with routine activities such as:
- Detecting, notifying, diagnosing, and resolving errors in the database system or underlying infrastructure.
- Allocation of memory and storage resources.
- Changing the database’s design Optimizing database query answers for improved application performance.
Data Management
It is the practice of gathering, storing, and utilizing data in a secure, efficient, cost-effective manner. As businesses increasingly rely on intangible assets to produce value, having a precise data management strategy is more critical than ever. The objective of data management is to assist businesses in optimizing data utilization within laws and regulations so that they may make choices and take actions that maximize the organization’s profit. It entails a range of duties and approaches, including:
- At several data layers, data may be generated, viewed, and changed.
- Information may be stored in a variety of clouds.
- There is high availability and data recovery.
- Ensure that your information is safe and secure.
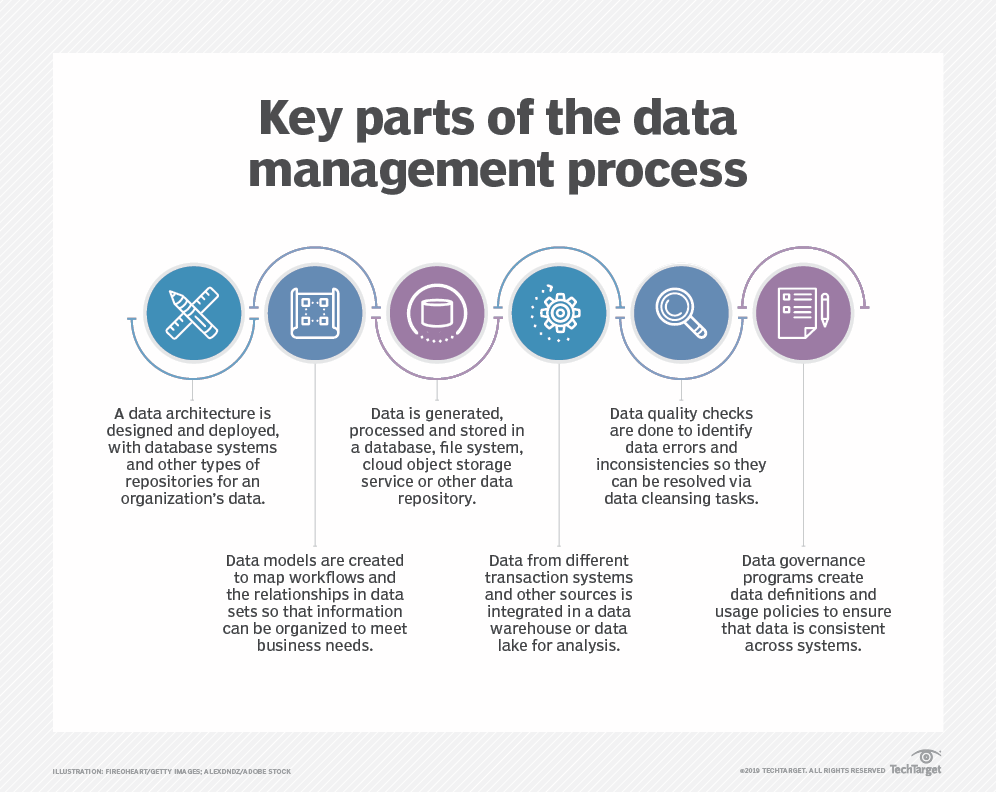
Fig. Link: https://cdn.ttgtmedia.com/rms/onlineimages/data_management-key_parts_of_process.png
Data management is also becoming increasingly important as businesses
confront a slew of regulatory compliance requirements, such as data privacy and protection legislation. Companies are collecting ever-increasing volumes of data and a greater range of data types, both of which are features of the big data platforms that many have installed. They may not survive without proper data management.
Data Management Systems:
Today’s companies require a data management system that effectively manages a varied yet unified data layer. Data management systems are based on platforms and might contain databases, data lakes and warehouses, extensive data management systems, data analytics, and other features. All these components operate as a “data utility” to provide a company with the data management skills it requires for its applications and the analytics and algorithms that utilize the data generated by those apps. Despite contemporary technologies assistance database administrators (DBAs) in automating many conventional maintenance chores, manual intervention is still frequently necessary due to the scale and complexity of most database deployments. When manual intervention is required, the possibility of mistakes occurring increases. The autonomous database is a novel data management technology that aims to reduce manual data administration.
Big Data Management:
Because of their flexibility to store and manage multiple data types, NoSQL databases are frequently utilized in big data deployments.
Data Integration:
The most typical method of data integration is an extract, transform, and load, which pulls data from source systems, transforms it to logical order, and stores the merged information in a data warehouse or other destination system.
Data Modeling:
Data modelers develop a collection of conceptual, logical, and physical data models that visually describe data sets and workflows and connect them to business needs for transaction processing and analytics. Entity-relationship diagrams, data mappings, and schemas are all typical data modeling approaches.
Data Visualization
Let’s look at how to view data after data management. Data visualization is the process of displaying data using graphs such as charts and diagrams. Visualization tools, which include visual components like tables, charts, and maps, make it simple to detect and evaluate trends, outliers, and patterns. In the age of big data, data visualization tools are critical for analyzing massive quantities of data and making data-driven choices. Although data visualization is a relatively recent concept, data has been graphically represented since the invention of writing.
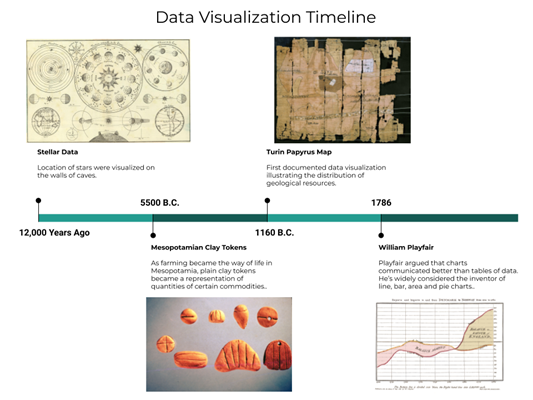
Fig. Link: https://chartio.com/images/blog/the-evolution-of-data-visualization/timeline.png
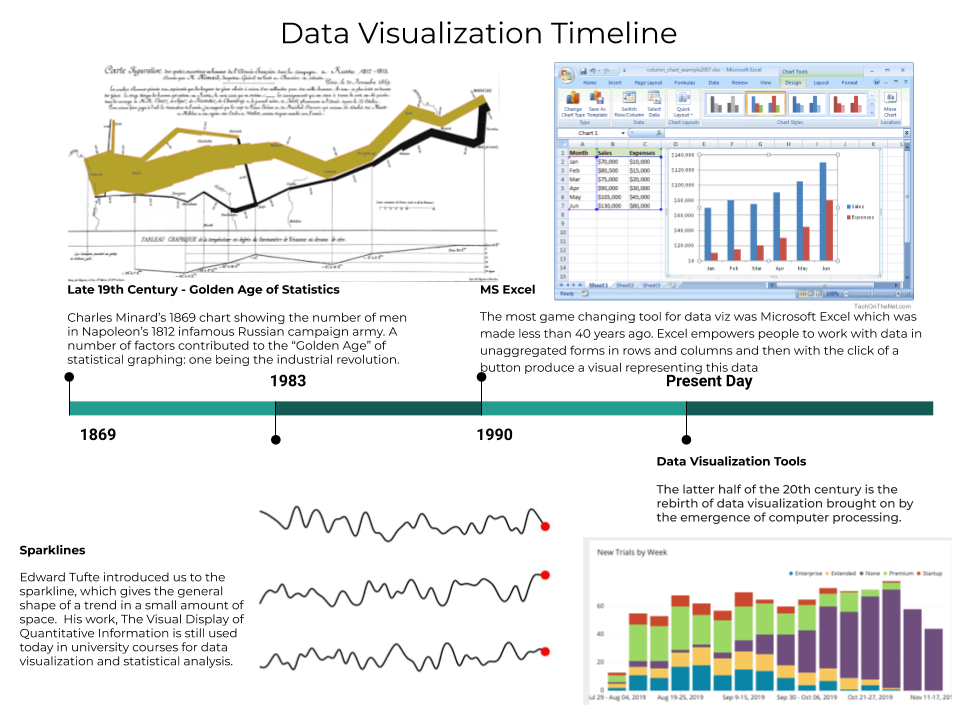
Throughout history, many different tools have been created. These applications can handle bigger data files and have a wider range of chart styles to choose from. These data visualization technologies have progressed from static statistics to dynamic representations that combine information from various sources. Data visualization is how experts interpret their findings after familiarizing themselves with the data. Now, executives who are unfamiliar with their company’s data want to do the same thing.
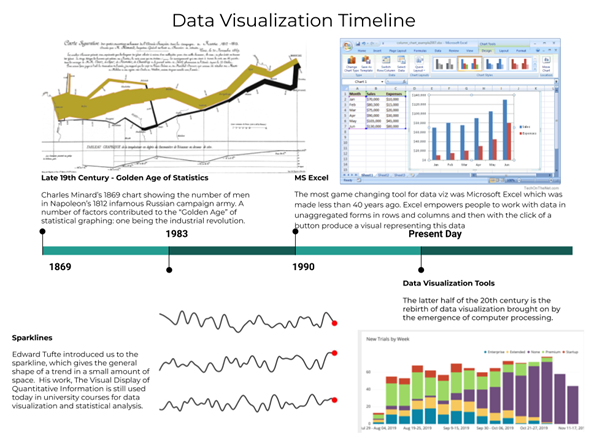
Fig. Link: https://chartio.com/images/blog/the-evolution-of-data-visualization/timeline2.png
We are lured in with the help of beautiful patterns. We can easily distinguish between purple and blue, as well as squares and circles. Our way of life is obvious, hiding everything from work and advertising and marketing to tv and movies. Data visualization is any visible painting form that piques our interest and keeps us focused on the message. Data visualization adds to the story by clearly presenting data and emphasizing characteristics and outliers. It is not as simple as just enlarging a chart or inserting it within the body of an infographic to increase its appeal. Effective data visualization necessitates careful shape and feature stability. The most obvious may be too foolish to pique anyone’s interest, or it may make a compelling case; the most amazing common overall performance will not communicate the critical information at all, or in other words, the volume. It is difficult to establish a professional field that thrives by making information easy to grasp. Because vision is so pervasive, it’s also one of the most advantageous painting abilities to acquire. The better graphically you can express your thoughts, whether in dashboards or slides, the more effectively you will be able to adhere to those lists. Professionals can also utilize data to make decisions and graphics to offer testimony on how data records are becoming more essential. While traditional education separates students into inventive storytelling and technical analysis, the current expert worldwide favors those who can combine the two.